
AHMETBURAKAKTAS
about
work
contact
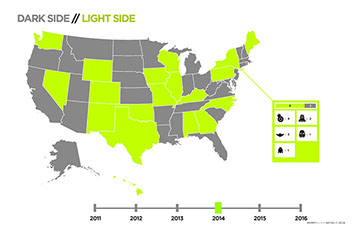
dark side
_
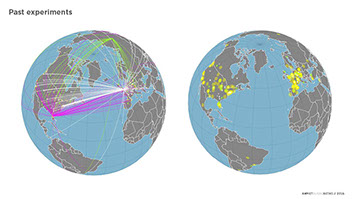
2D and 3D data visualization of Thingiverse® 3D printing data
2016
Tracking the 3D Printed
Intent
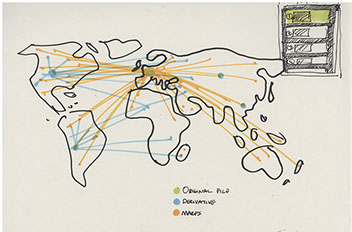
We live in a more connected world than ever. But the connection is not limited to digital world any more. We are also connected with physical objects to each other. With the domestication of 3D printing technologies, we can create an object, put it online and see the world making the same object themselves. This is a unique way of connection, and this work aims to visualize it.
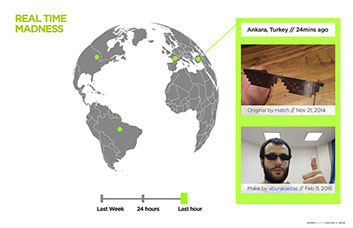
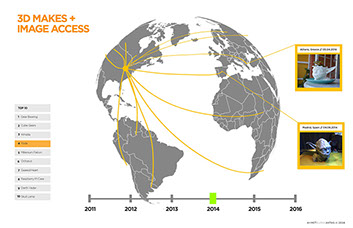
The intent of this work is visualizing the paths of digital 3D objects travelling around the world and getting their original or remixed physical shapes, using the data gathered from Thingiverse®, the most popular 3D printing portal.
Methodology
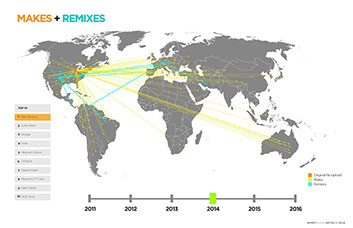
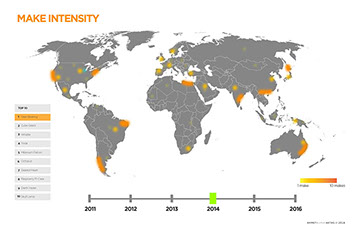
Most made objects on Thingiverse have been listed and some of them were picked to make an even distribution of samples from each different areas of 3D objects, being: functional, test objects, popular culture and decorative. After selecting the objects to be visualized, the datasets for each of them were gathered through Thingiverse API using a Java code. It was important to get the dataset for not only the original makes but also the remixes and makes of the remixes, so that it would be a more comprehensive visualization for each object.
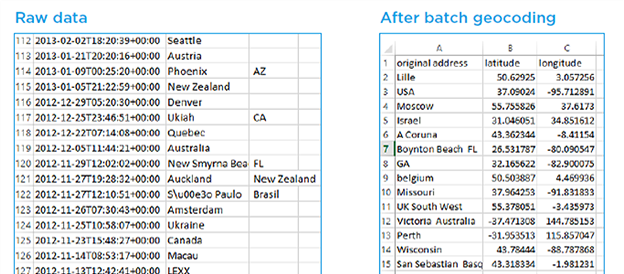
Dataset
The dataset included city / country / state and time. The location information was converted to Lat/Long data using a free online batch geocoding website. This process was repeated for makes and up to three most popular remixes of each object.
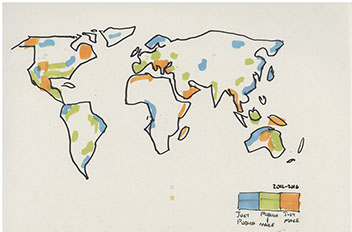
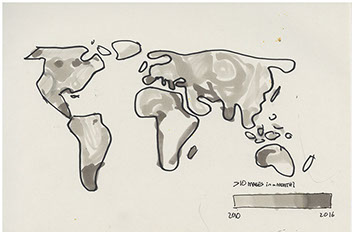
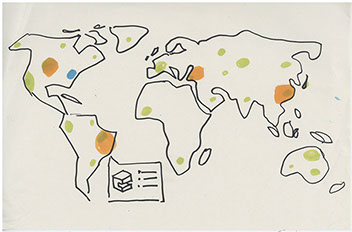
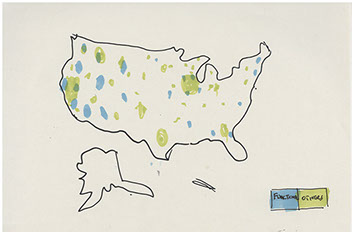
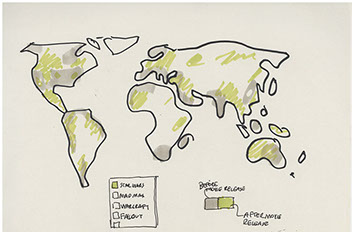
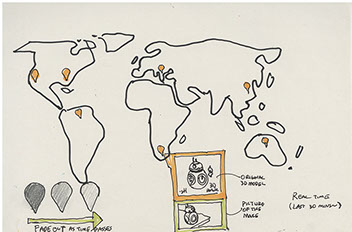
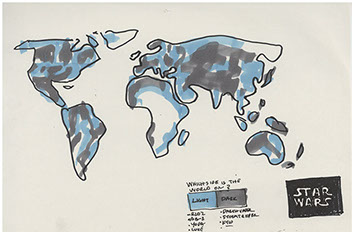
Some early visualization ideas
Refined visualization mock-ups using Illustrator
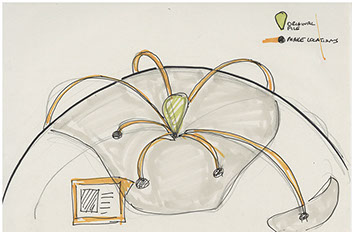
Making it 3D
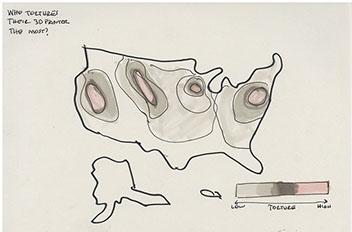
The approach of visualizing the same dataset was mapping the latitude and longitude data of the makes as polar points on the object and deforming the shape by moving those points from centroid of the object to outside. With this method, every digital 3d file can be visualized and 3d printed to show its digital connections with the physical world. The map texture is used to augment the readability of the visualization.
The process
After making play-doh and styrofoam models to quickly represent the visualization ideas, the concept of using the stl file of the object to be visualized and deforming it with data was selected. There were lots of explorations done with this concept, including using spheres and pipes to represent data and spatially deforming the object. Finally spherical mapping the world map on the object and deforming the points of the make coordinates method was used.
3D objects
Two of the most made objects on Thingiverse were selected to be 3D printed as data objects for the final presentation. These objects contain their own 3D printing data on them. Data objects were 3D printed using full color sandstone 3D printer and their originals were printed using a conventional FDM 3D printer. Here are some pictures of the objcets.
Challenges
The biggest challenge was the limitation of using the Thingiverse API. The dataset did not include Lat/Long but only city state or country which was written by the user. So a significant amount of the dataset was useless since some users left the location empty or wrote imaginary places.
Final exhibition
© 2017 Ahmet Burak Aktas